3 posts tagged with "kubernetes"

View All Tags

· 6 min read
Jeffrey Aven

Apache Spark in GCP

In the previous post in this series Spark in the Google Cloud Platform Part 1, we started to explore the various ways in which we could deploy Apache Spark applications in GCP. The first option we looked at was deploying Spark using Cloud DataProc, a managed Hadoop cluster with various ecosystem components included.

In this post, we will look at another option for deploying Spark in GCP – a Spark Standalone cluster running on GKE.

Spark Standalone refers to the in-built cluster manager provided with each Spark release. Standalone can be a bit of a misnomer as it sounds like a single instance – which it is not, standalone simply refers to the fact that it is not dependent upon any other projects or components – such as Apache YARN, Mesos, etc.

A Spark Standalone cluster consists of a Master node or instance and one of more Worker nodes. The Master node serves as both a master and a cluster manager in the Spark runtime architecture.

The Master process is responsible for marshalling resource requests on behalf of applications and monitoring cluster resources.

The Worker nodes host one or many Executor instances which are responsible for carrying out tasks.

Deploying a Spark Standalone cluster on GKE is reasonably straightforward. In the example provided in this post we will set up a private network (VPC), create a GKE cluster, and deploy a Spark Master pod and two Spark Worker pods (in a real scenario you would typically have many Worker pods).

Once the network and GKE cluster have been deployed, the first step is to create Docker images for both the Master and Workers.

The Dockerfile below can be used to create an image capable or running either the Worker or Master daemons:

Note the shell scripts included in the Dockerfile: spark-master and spark-worker. These will be used later on by K8S deployments to start the relative Master and Worker daemon processes in each of the pods.

Next, we will use Cloud Build to build an image using the Dockerfile are store this in GCR (Google Container Registry), from the Cloud Build directory in our project we will run:

gcloud builds submit --tag gcr.io/spark-demo-266309/spark-standalone

Next, we will create Kubernetes deployments for our Master and Worker pods.

Firstly, we need to get cluster credentials for our GKE cluster named ‘spark-cluster’:

gcloud container clusters get-credentials spark-cluster --zone australia-southeast1-a --project spark-demo-266309

Now from within the k8s-deployments\deploy folder of our project we will use the kubectl command to deploy the Master pod, service and the Worker pods

Starting with the Master deployment, this will deploy our Spark Standalone image into a container running the Master daemon process:

To deploy the Master, run the following:

kubectl create -f spark-master-deployment.yaml

The Master will expose a web UI on port 8080 and an RPC service on port 7077, we will need to deploy a K8S service for this, the YAML required to do this is shown here:

To deploy the Master service, run the following:

kubectl create -f spark-master-service.yaml

Now that we have a Master pod and service up and running, we need to deploy our Workers which are preconfigured to communicate with the Master service.

The YAML required to deploy the two Worker pods is shown here:

To deploy the Worker pods, run the following:

kubectl create -f spark-worker-deployment.yaml

You can now inspect the Spark processes running on your GKE cluster.

kubectl get deployments

Shows...

NAME           READY   UP-TO-DATE   AVAILABLE   AGE
spark-master 1/1 1 1 7m45s
spark-worker 2/2 2 2 9s
kubectl get pods

Shows...

NAME                            READY   STATUS    RESTARTS   AGE
spark-master-f69d7d9bc-7jgmj 1/1 Running 0 8m
spark-worker-55965f669c-rm59p 1/1 Running 0 24s
spark-worker-55965f669c-wsb2f 1/1 Running 0 24s

Next, as we need to expose the Web UI for the Master process we will create a LoadBalancer resource. The YAML used to do this is provided here:

To deploy the LB, you would run the following:

kubectl create -f spark-ui-lb.yaml

NOTE This is just an example, for simplicity we are creating an external LoadBalancer with a public IP, this configuration is likely not be appropriate in most real scenarios, alternatives would include an internal LoadBalancer, retraction of Authorized Networks, a jump host, SSH tunnelling or IAP.

Now you’re up and running!

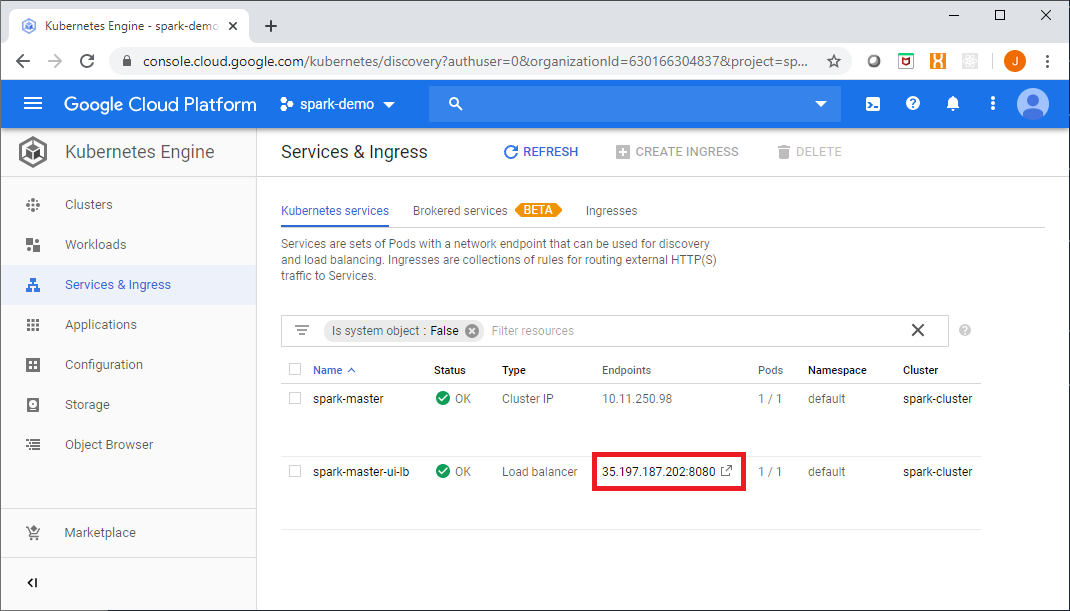
You can access the Master web UI from the Google Console link shown here:

Accessing the Spark Master UI from the Google Cloud Console

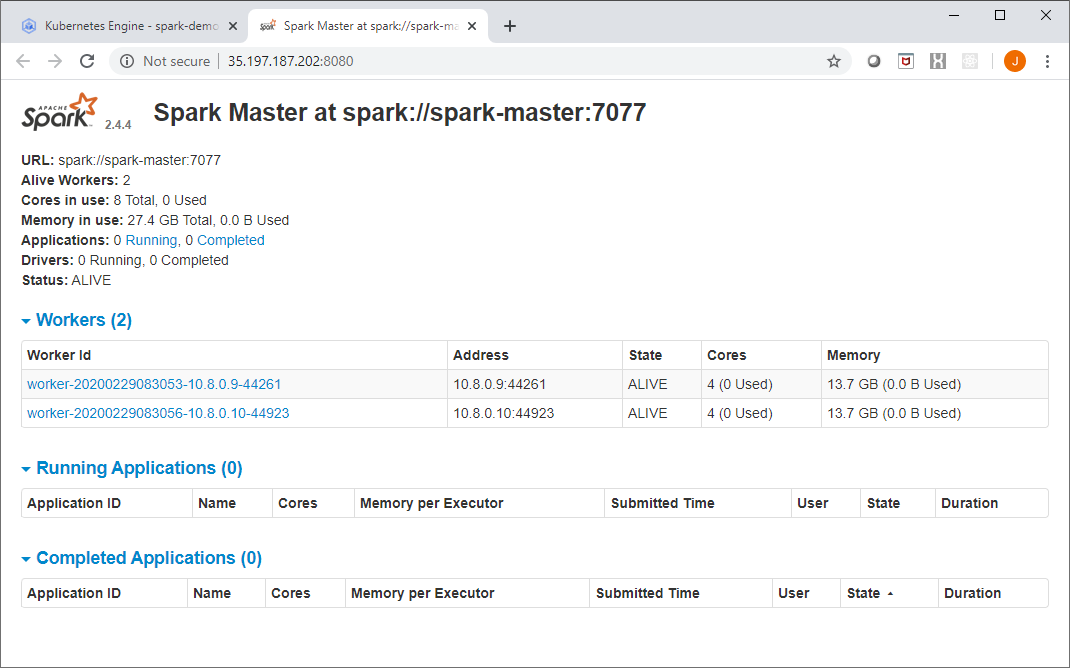
The Spark Master UI should look like this:

Spark Master UI

Next we will exec into a Worker pod, get a shell:

kubectl exec -it spark-worker-55965f669c-rm59p -- sh

Now from within the shell environment of a Worker – which includes all of the Spark client libraries, we will submit a simple Spark application:

spark-submit --class org.apache.spark.examples.SparkPi \
--master spark://10.11.250.98:7077 \
/opt/spark/examples/jars/spark-examples*.jar 10000

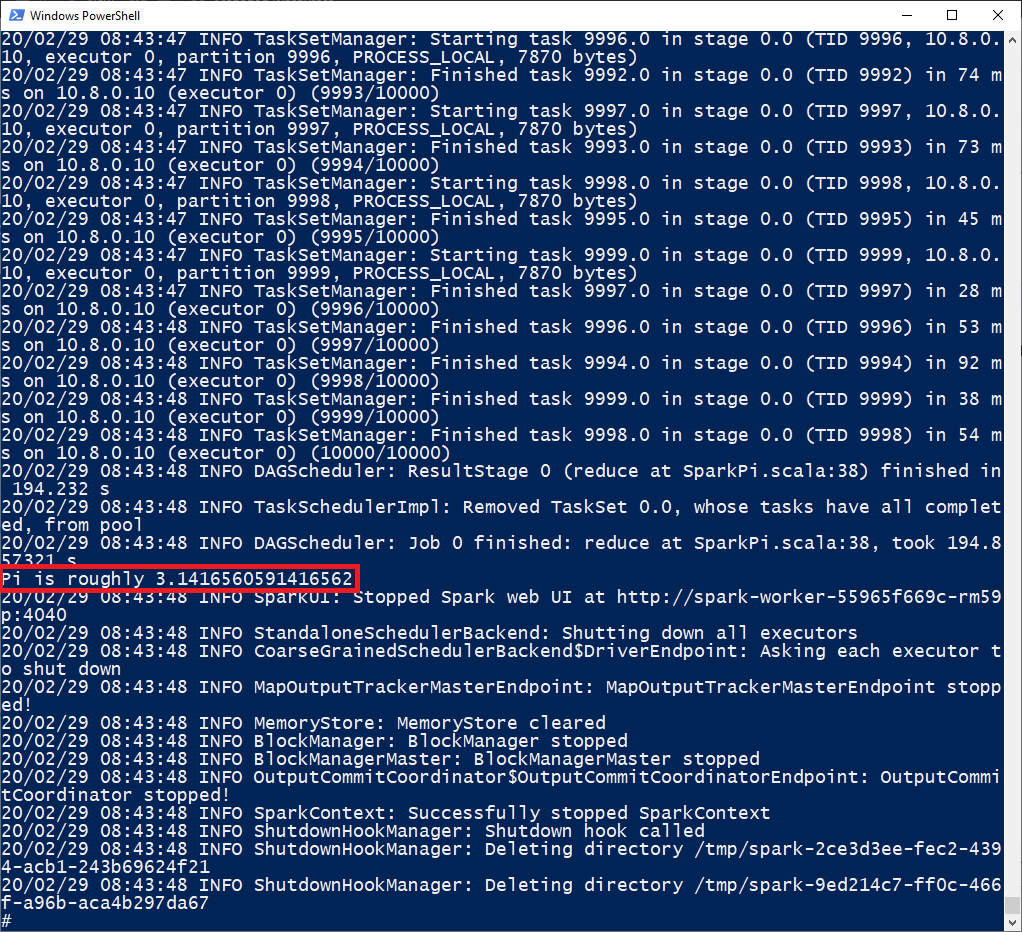
You can see the results in the shell, as shown here:

Spark Pi Estimator Example

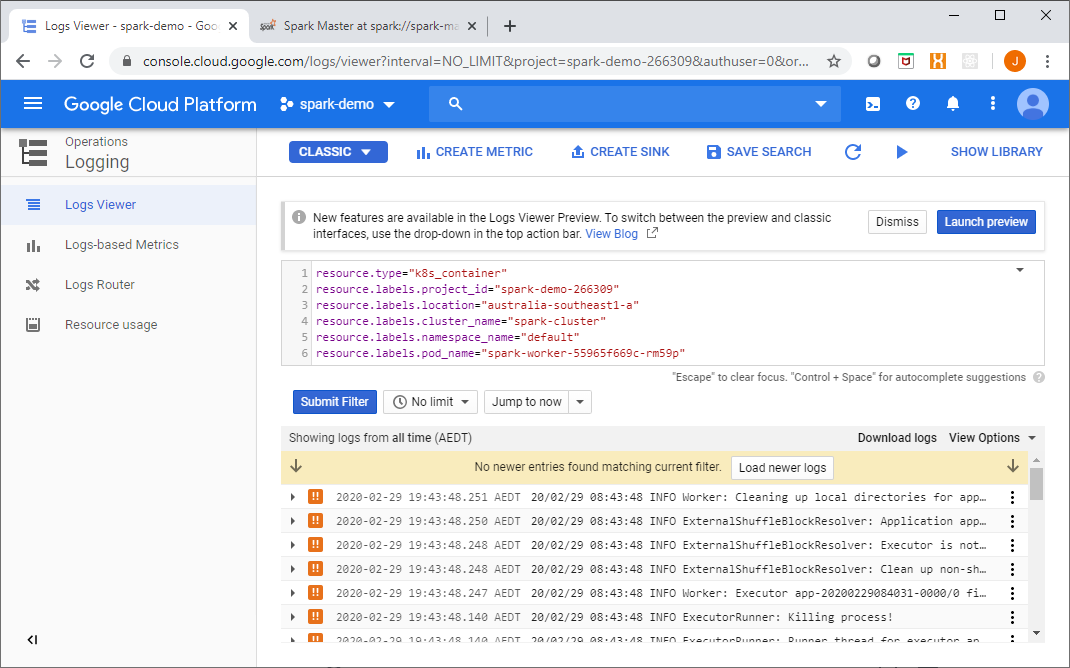
Additionally, as all of the container logs go to Stackdriver, you can view the application logs there as well:

Container Logs in StackDriver

This is a simple way to get a Spark cluster running, it is not without its downsides and shortcomings however, which include the limited security mechanisms available (SASL, network security, shared secrets).

In the final post in this series we will look at Spark on Kubernetes, using Kubernetes as the Spark cluster manager and interacting with Spark using the Kubernetes API and control plane, see you then.

Full source code for this article is available at: https://github.com/gamma-data/spark-on-gcp

The infrastructure coding for this example uses Powershell and Terraform, and is deployed as follows:

PS > .\run.ps1 private-network apply <gcp-project> <region>
PS > .\run.ps1 gke apply <gcp-project> <region>

if you have enjoyed this post, please consider buying me a coffee ☕ to help me keep writing!
· 5 min read
Tom Klimovski

Service Mesh

This is a follow up to the previous post:

Sick of hearing about Service Mesh? Here’s what you need to know...

Refresher

A refresher on the data plane, and what the userspace proxy can perform:

  • Routing: Given a REST request for /hello from the local service instance, where should that request be sent?
  • Load Balancing: Once routing has done its job, to which upstream service instance should the request be sent? With what timeout? If the request fails, should it be retried?
  • Authorisation and Authentication: For requests that are incoming, can cryptographic functions determine the authenticity of that requests? Is the called allowed to invoke the requested endpoint?
  • Observability: Detailed logging, statistics, distributed tracing data so that operators can understand the traffic flow and debug problems as they occur
  • Service Discovery: What backend/upstream service instances are available?
  • Health Checking: Are upstream service instances healthy and ready to accept traffic?

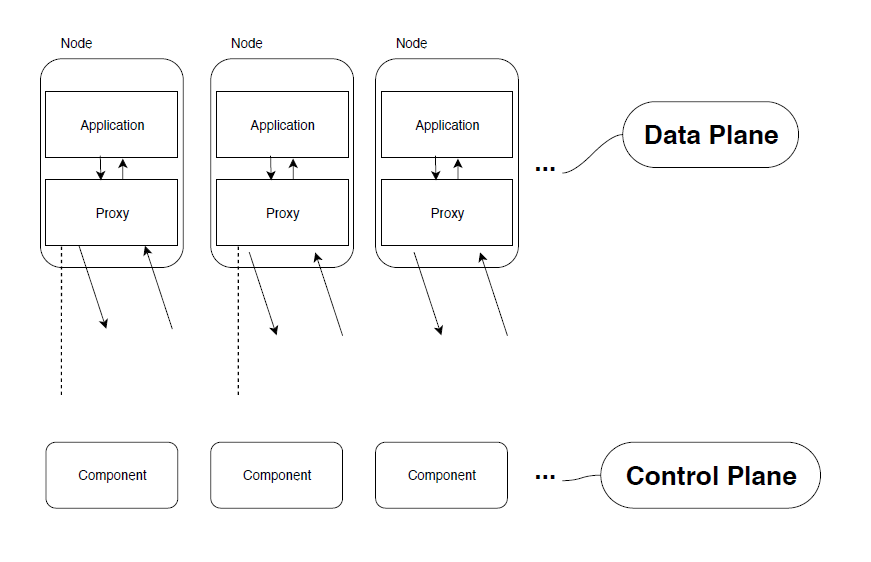
The control plane is slightly less complex. For the data plane to act in a coordinated fashion, the control plane gives you the machinery to make that happen. This is the magical part of the service mesh; the control plane takes a set of isolated sidecar proxies and turns them into a distributed system. The control plane in turn provides an API to allow the user to modify and inspect the behaviour of the data plane.

You can see from the diagram below the proxies are right next to the service in the same node. We usually call those 'sidecar' containers.

The diagram above gives you a high level indication of what the service mesh would look like. What if I don't have many services? Then the service mesh probably isn't for you. That's a whole lot of machinery to run a single proxy! Having said this, if your solution is running hundreds or thousands of services, then you're going to require a whole heap of proxies.

So there you have it. The service mesh with its control and data plane. To put it simply, the goal of the control plane is to monitor and set a policy that will eventually be enacted by the data plane.

Why?

You've taken over a project, and the security team have mandated the use of the service mesh. You've never used it yourself before, and the confusion as to why we need another thing is getting you down. An additional thing next to my container that will add latency? And consume resources? And I have to maintain it?! Why would anyone need or want this?

While there are a few answers to this, the most important answer is something I alluded to in an example in part 1 of this series: this design is a great way to add additional logic into the system. Not only can you add additional logic (to containers possibly outside of your control) but you can do this uniformly across the entire mesh! The service mesh gives you features that are critical for running software that's uniform across your whole stack

The set of features that the service mesh can provide include reliability features (Retries, timeouts etc), observability features (latencies, volume etc) and security features (mTLS, access control etc).

Let's break it down

Server-side software relies on these critical features If you're building any type of modern server-side software that's predicated on multiple services, think API's and web-apps, and if you're continually adding features to this in a short timeframe, then all the features listed above become critical for you. Your applications must be reliable, observable and most importantly secure. This is exactly what the service mesh helps you with.

One view to rule them all The features mentioned above are language-agnostic, don't care about your framework, who wrote it or any part of your development life cycle. They give you, your team and your company a consistent way to deploy changes across your service landscape

Decoupled from application code It's important to have a single place to include application and business logic, and not have the nightmare of managing that in multiple components of your system. The core stewardship of the functionality that the service mesh provides lies at the platform level. This includes maintenance, deployments, operation etc. The application can be updated and deployed by developers maintaining the application, and the service mesh can change without the application being involved.

In short

Yes, while the features of the service mesh could be implemented as application code, this solution would not help in driving uniform features sets across the whole system, which is the value proposition for the service mesh.

If you're a business-logic developer, you probably don't need to worry about the service mesh. Keep pumping out that new fangled business logic that makes the software oh-so-usable

If you're in a platform role and most likely using Kubernetes, then you should be right on top of the service mesh! That is unless your architecture dictates a monolith. You're going to have a lot of services talking to one another, all tied together with an overarching dependency.

If you're in a platform role with no Kubernetes but a bunch of microservices, you should maybe care a little bit about the service mesh, but without the power of Kubernetes and the ease of deployment it brings, you'll have to weigh up how you intend to manage all those proxies.

I hope you enjoyed this article, please feel free to reach out to me at:

Tom Klimovski
Principal Consultant, Gamma Data
tom.klimovski@gammadata.io

· 4 min read
Tom Klimovski

Service Mesh

So you’ve started delivering a new project and it’s all about this “Cloud Native” or “Microservices” thing. You’re a Delivery Manager or Software Engineer at some type of company and someone has lightly peppered a meeting with a term, ‘Mesh’.

They possibly said event mesh. Or better yet, they mentioned a service mesh. As time went on you kept hearing more and more about the service mesh. You’ve attempted to read up about it, digested a whole bunch of new terms and still didn’t completely understand what the Mesh even does, why you would need it or why the hype train around this technology shows no sign of stopping. This article is an attempt to provide a focused guide to the service mesh, and why it is so interesting.

Ok, so what is this thing?

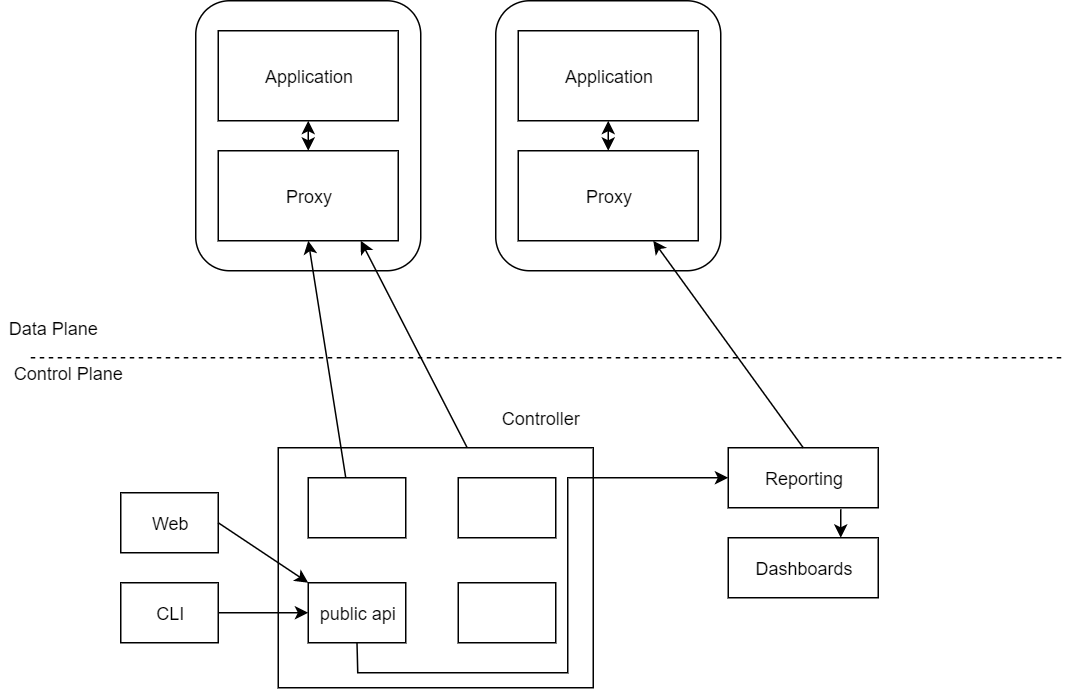
Truth be told, the service mesh is actually pretty simple. It’s built around the idea of small, repeatable bits of software, in this case userspace proxies, stuck very close to your services. This is called the data plane. In addition to the userspace proxies, you also get a bunch of management processes, which is referred to as the control plane. Simply put, the data plane (userspace proxies) intercepts all calls between services and the control plane (management processes) coordinates the wholesale behaviour of those proxies. This allows you to perform sweeping changes across your service landscape via the control planes API’s, operators and provides the capability to measure your mesh as a whole.

Before we get into the engineering of what the proxies are, let’s go with an example.

  • The business has bought some software.
  • The engineers are tasked with deploying this software in their Kubernetes cluster.
  • The engineers first task is to containerise this application, expose its functionality to downstream applications and deploy it to the cluster in a repeatable, continuous fashion.
  • There’s a requirement in your organisation that says ‘I need all communications to this vendors software as TLS1.3’. Or, ‘I would like to measure all API latency from this application’.

The engineer replies ‘I can’t make changes to a third party application! What do I do?’. Service mesh to the rescue.

Using a service mesh, you can deploy a proxy right next to your vendor container and in effect, abstract away the complexities of measurement and data transport mechanisms, and allow the vendor software to concentrate on it’s business logic.

This vendor container is now part of the service mesh.

Proxies

When we talk about proxies, we usually discuss things in OSI model terminology, that is to say Layers 1 through 7. Most of the time when it comes to proxies, you’re comparing Layer 4 to Layer 7. Here’s a quick run-down:

Layer 4 (L4) -> operates with the delivery of messages with no regard to the content of the messages. They would simply forward network packets to and from the server without inspecting any part of the packets.

Layer 7 (L7) -> this is a higher level, application layer. This deals with the actual content of the message. If you were routing network traffic, you could do this at L7 in a much more sophisticated way because you can now make decisions based on the packets messages within.

Why pick between L4 and L7? Speed.

Back to the service mesh, these userspace proxies are L7-aware TCP proxies. Think NGINX or haproxy. There are different proxies; Linkerd is an ultralight service mesh for Kubernetes. The most popular is Envoy, which was created by the ride-share company Lyft. Above, I also mentioned NGINX and haproxy which are also quite popular. So what differentiates NGINX proxies from the service mesh? Their focus. You would implement NGINX as an Ingress proxy (traffic entering your network), but when it comes to proxies that focus on traffic between services, that’s when the service mesh proxy comes in to play.

Ok, probably time for a diagram now that we’ve explained the Data Plane.

Tune in for part 2 for when we discuss the Control Plane!